
Introduction
This page describes how Alexis Huxley installed and configured a Check_MK server. It is mostly take from the official documentation.
Installing the Check_MK server
- Download the Checkmk Raw Edition from here.
- Download it to the server. E.g. with:
wget https://checkmk.com/support/1.6.0p7/check-mk-raw-1.6.0p7_0.buster_amd64.deb
- Install that package and then correct any dependency errors:
dpkg -i *.deb
apt-get install -f
- Decide upon a monitoring site name (e.g. ‘default’).
- Create the site. E.g. with:
omd create default
- Note the admin’s login and password as displayed in the output of the command in the previous step.
- Make the monitoring site’s web interface accessible on all interfaces:
su - default
omd config
- Start the monitoring site:
omd start default
- Note that the above commands modify /etc/fstab (this has implications for PCMS-based installs).
Proxying connections to the monitoring site
- Note the port number specified in /omd/sites/default/etc/apache/listen-port.conf (probably 5000).
- See Configuring web services (revision 2).
Adding users
- Log in to the web interfaces as cmkadmin, go to WATO (lower left area of screen), go to Users.
- Follow the prompts.
- Log out as cmkadmin and log in as the new user.
- Tailor the side panel to suit your personal preferences.
Adding hosts – server side
- In a terminal, generate a list of hosts, one per line (e.g. with Rocon). Copy this list with the mouse.
- Log in to the web interfaces as cmkadmin, go to WATO, go to Hosts, go to Bulk Import.
- From the pulldown menu select ‘Content of CSV File’, paste in the hostnames, select ‘Perform automatic service discovery’, click ‘Upload’.
- At the ‘Bulk host import’ page, in the preview area, select ‘Hostname’ from the pulldown menu and click ‘Import’.
- At the ‘Bulk discovery’ page, accept the defaults and click ‘Start’ and when the discovery completes click ‘<N>+ Changes’
- If the warning ‘There are some changes made by your colleagues that you will activate if you proceed …’ appears then click the ‘Activate changes of other users’ checkbox.
- Click ‘Activate affected’.
Adding hosts – client side
PCMS takes care of this for me.
- Install check-mk-agent (links are provided at WATO–>Monitoring Agents–>Packaged Agents).
- Install xinetd.
Performing checks over ssh
This section is based on the official documentation.
- On the server run:
omd sites
omd su <site-name>
cat id_ed25519.pub
- On the client, add a line like the following to ~root/.ssh/authorized_keys:
command="/usr/bin/check_mk_agent" ssh-ed25519 ...
- Perform a full service scan.
Using custom service checking scripts
- Write the script; it should return 0 on success, 1 for warning, 2 for critical and 3 for unknown (see the Nagios Plugin API docs for more details).
- Copy it to /opt/omd/sites/<site-instance>/local/lib/nagios/plugins/.
- If testing a “host” that provides only services – for example a website service like www.pasta.freemyip.com – then add the host but be sure to disable the use of the check_MK agent (by clicking on the ‘Check_MK Agent’ checkbox but then selecting ‘No agent’ from the pulldown menu).
- Add a rule (WATO–>Hosts and Service Parameters–>Active Checks–>Classical checks and passive Monitoring checks–>Create rule in folder), setting explicit hosts on which the check should executed.
Changing thresholds of builtin checks on a per-host basis
- Go to WATO–>Hosts and Service Parameters–>Parameters for discovered services.
- Locate the service the parameters of which you wish to change and click it. (This is not straightforward as the names used in alerts do not correspond with the names listed here and I do not see how to map from one to the other.)
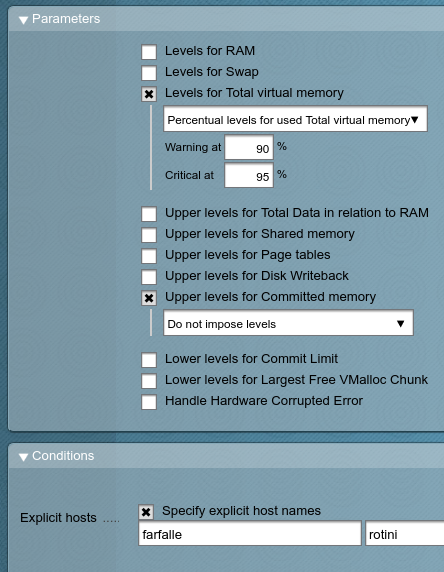
- Add the new thresholds. Note that any check for which you do not explicitly set a threshold or explicitly ignored the check will continue to work as before. For example, for two systems with SSDs, I stop monitoring committed memory and raise the warning and critical thresholds for total virtual memory used:
Monitoring Windows XP
Not written yet.